Predicting the arrival times of inland containers, especially rail, is one of the toughest problems in logistics. Rail introduces countless unknowns: variable terminal dwell times, incomplete milestone data, inconsistent rail reporting, and unpredictable congestion.
At Terminal49, we’re not chasing false precision. We’re developing a system to understand and communicate ETA uncertainty—a framework that enables shippers and forwarders to plan confidently, even when the data isn’t perfect.
The Realities of Rail ETA Prediction
Inland ETA prediction isn’t just a technical challenge; it’s a reflection of how unpredictable logistics really is.
Here’s why it’s so difficult:
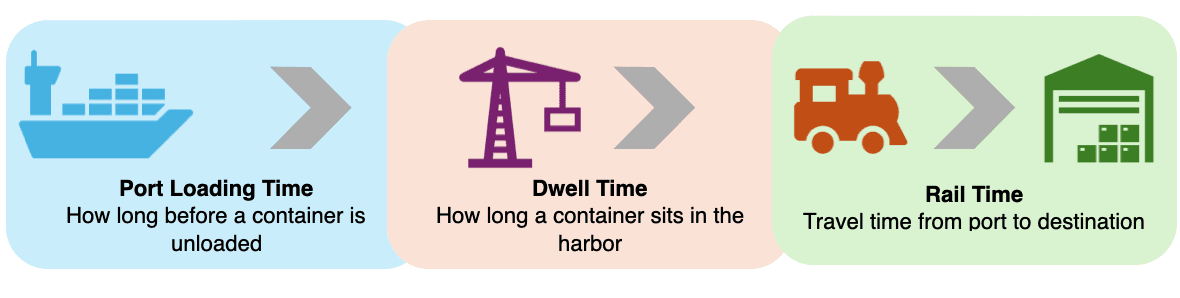
- Terminal dwell time is highly variable. Containers can sit for hours or days depending on yard space, customs, or vessel delays.
- Rail schedules aren’t public or consistent. Each railroad operates differently, with opaque routing and handoffs.
- Milestones can be delayed or misleading. A “departed rail” update might appear 12 hours after the fact.
Even the most advanced algorithm can’t perfectly forecast these events. Real-world logistics are stochastic, meaning they are subject to random variation. The key isn’t to eliminate uncertainty, but to quantify and communicate it.
A Segmented Modeling Framework
Rather than forcing a single model to predict the entire inland journey, we break it into four segments:
- Arrival to Berth
- Berth to Discharge
- Terminal Dwell Time
- Rail Transit Time
Each phase is modeled independently using historical data and features relevant to that phase. This gives us:
- Granular control over how each stage behaves
- Transparency into where errors originate (e.g., dwell vs. transit)
- Flexibility to evolve models as new data sources become available
Data Quality: The Foundation of Predictability
Every model is only as good as its inputs. We evaluate our data on three dimensions:
Latency / Real-Time
How fresh is the data?
Delayed milestones degrade prediction accuracy. A “Departed Rail” event that surfaces 12 hours late makes any model instantly outdated.
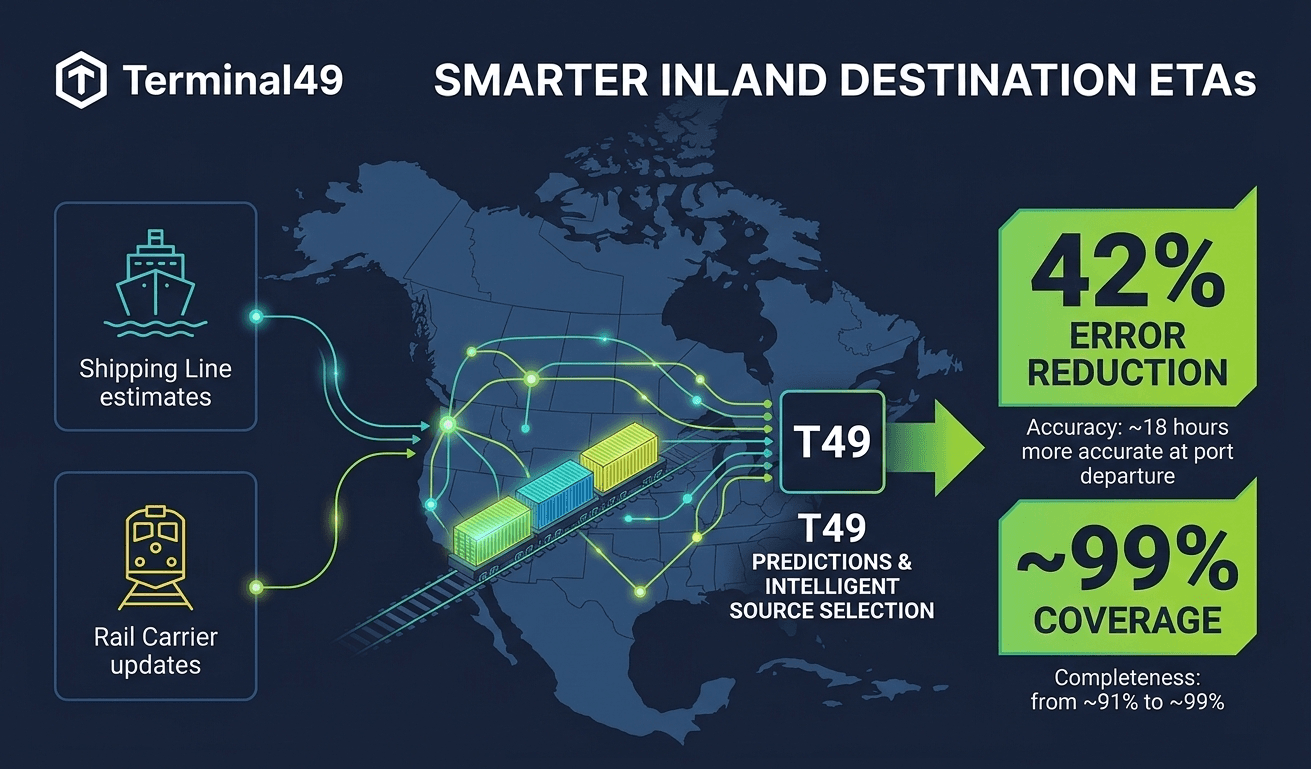
How we mitigate: We ingest data not only from shipping lines, but also directly from ocean terminals and rail carriers—giving us fresher, more complete visibility.
Completeness / Context
Does the data provide enough operational context?
A “Discharged” container bound for Dallas behaves very differently than one staying in LA.
How we mitigate: We integrate routing context, terminal metadata, and customer-specific behavior to enrich milestone data.
Accuracy
Are the milestones and timestamps correct?
Bad timestamps or mislabeled routes pollute both training and prediction.
How we mitigate: Automated validation and cross-source comparison flag inconsistencies before they affect the model.
Modeling in Practice
We train on historical movement data and evaluate against unseen shipments to simulate real-world conditions:
- Training set: older containers (e.g., first 80%)
- Test set: more recent containers (last 20%)
- Shadow testing: predictions run alongside live shipments before becoming customer-facing
Since uncertainty is inherent, we present ETA windows rather than fixed dates.
For example: “Expected arrival between Sept 18–21 (95% confidence).”
That approach fosters trust through transparency and enables customers to plan flexibly, acknowledging the operational volatility of ports and rail.
What We’ve Learned
- Better data beats better models. Improving inputs such as timeliness, completeness, and accuracy often yields a greater impact than algorithmic tuning.
- Some phases are predictable; others aren’t. Berth times are relatively stable. Dwell and rail times vary by season, terminal, and even macroeconomic conditions, such as labor disruptions.
- Distance matters—but representation matters more. We’re enhancing our modeling of true rail routes, rather than relying on simple straight-line distances.
What’s Next
We’re continuing to refine this system through:
- Smarter feature engineering (e.g., vessel congestion or terminal geofencing data)
- Improved rail distance metrics
- Outlier detection to flag unreliable predictions
- Benchmarking performance by lane, terminal, and customer behavior
The Takeaway
Predictive ETAs aren’t about perfection—they’re about useful transparency.By segmenting the container journey, validating data across multiple sources, and presenting ETA ranges with confidence, Terminal49 is setting a new standard for visibility and trust in inland logistics.
We’re not just building models. We’re building clarity in an uncertain world.
Key Takeaways
- Adopt segmented ETA modeling to provide more transparent and actionable arrival windows for inland containers, especially on rail.
- Prioritize data freshness, completeness, and accuracy over complex algorithms to improve ETA reliability.
- Model each journey phase separately to pinpoint where delays or errors occur and adapt as new data becomes available.
- Present ETA ranges instead of fixed dates to help customers plan confidently amid real-world logistics uncertainty.
- Continuously refine predictions by integrating new data sources, smarter features, and robust outlier detection.